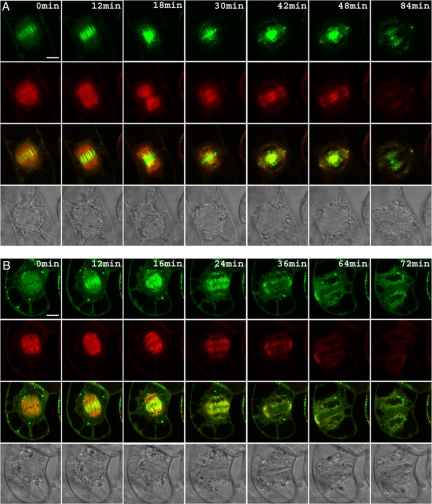
Figure 8.
AtMAP65-5 accumulates in the midzone in metaphase until late anaphase. Time-lapse recording of tobacco BY-2 cells expression AtMAP65-5-GFP and RFP-TUA6 (A) and AtMAP65-1-GFP and RFP-TUA6 (B). The yellow signal in the third rows corresponds to the merged of RFP and GFP images. The rows at the bottom show differential interference contrast images. AtMAP65-5 strongly labels the midzone from late metaphase until late anaphase and the phragmoplast in telophase (A). Conversely AtMAP65-1 does not localized at the midzone during metaphase but appears at the onset of anaphase (B). Scale bar, 10 μm.

