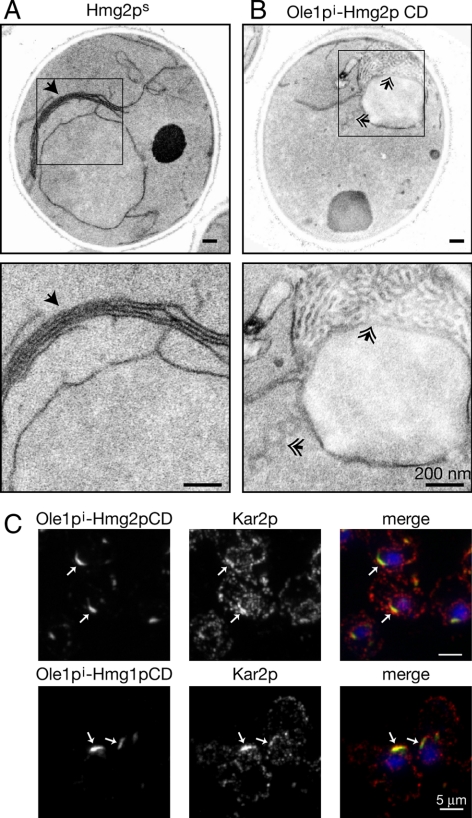
Figure 4.
The Ole1pi-HMGR CD fusions make distinct membrane structures. (A and B) Electron micrographs of strains with two TDH3pr-driven copies of Ole1pi-Hmg2p CD, inactive Ole1p fused to the CD of Hmg2p (A); and Hmg2ps (B) at 20,000 (top) and 80,000 (bottom) magnification. Solid arrows indicate stacks of membrane characteristic of Hmg2p. Double arrows indicate tubular membrane arrays generated by Ole1pi-Hmg2p CD fusion constructs. (C) IF imaging of strains harboring two copies of Ole1pi-Hmg2p CD (top) and Ole1pi-Hmg1p CD (bottom). Ole1pi fusions are green and Kar2p is red; nucleus is visualized with DAPI. Log phase cells were grown in YPD. Arrows indicate structures.

