
Figure 5. Binding pockets of Arg 307 mutant structures.
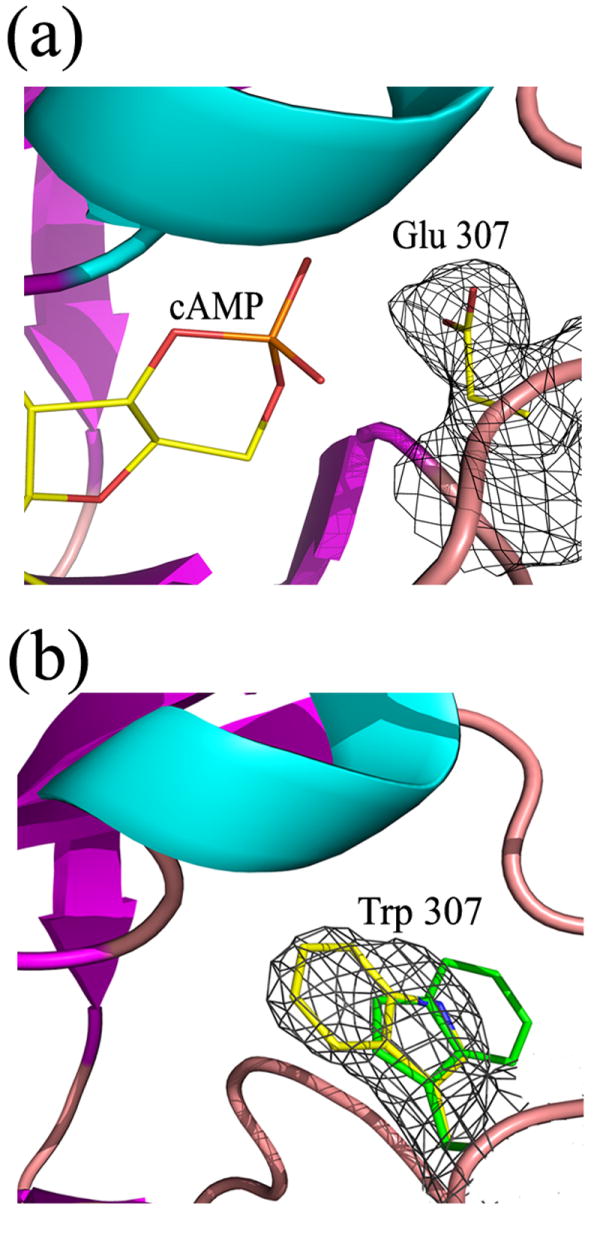
a) Binding pocket of R307E showing the electron density of the glutamate side chain (simulated annealing omit map contoured at 1.0 sigma). b) Binding pocket of R307W with the two tryptophan conformations, as observed in the different molecules of the asymmetric unit, superposed. Electron density (simulated annealing omit map contoured at 1.0 sigma) is shown for just one of the tryptophan side chains. The density map of the other conformer is just as good.