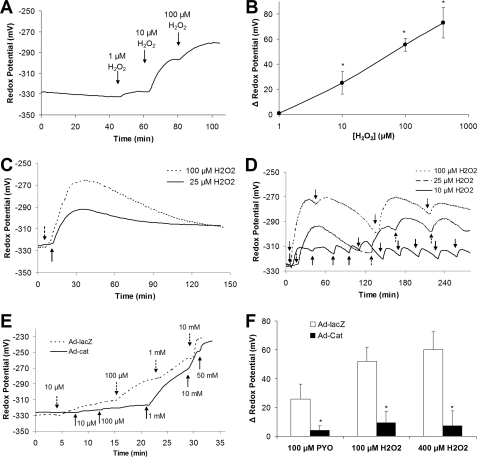
FIGURE 4.
Effects of H2O2 and catalase on cytosolic redox in CF15 cells. A, Ψcyto was measured during short term treatment of roGFP1-expressing cells with 1, 10, and 100 μm H2O2 in Ringer's solution. Experiment is typical of 13 similar experiments. B, summary change in Ψcyto (compared with controls) as function of [H2O2]. Average ± S.D. (n = 13 experiments); *, p < 0.05 compared with control. C, Ψcyto was measured during 2 h of treatment with 25 or 100 μm H2O2. There was a rapid increase during the first 15 min followed by slower decrease toward control levels over the course of about 100 min. D, Ψcyto was measured during repeated treatment of cells with 25 μm H2O2. Experiment is typical of three similar experiments. E, dose-dependent effects of H2O2 on Ψcyto were tested in CF15 cells infected with catalase (Ad-Cat, solid line) or β-galactosidase (Ad-lacZ, as control, dotted line) adenovirus. Data are typical of three similar experiments in each case. F, CF15 cells expressing catalase or β-galactosidase were treated with a single dose of 100 μm PYO or with repeated 30-min additions of 100 or 400 μm H2O2. Ψcyto were recorded before and after 2 h in five different regions of the cover glass each containing ≥10 different roGFP1-expressing cells. Averages ± S.D. (n = 3 experiments) for changes in Ψcyto in response to PYO or [H2O2] are shown. *, p < 0.05 compared with no catalase expression.

