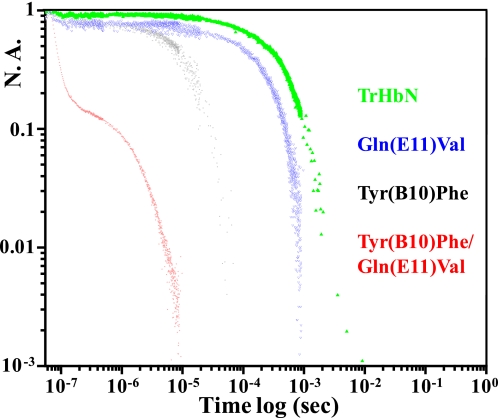
FIGURE 4.
Kinetic traces showing the recombination of CO subsequent to nanosecond photodissociation of the CO-saturated derivatives of wild-type trHbN and its distal mutants. The recombination traces are displayed on a log-log plot with the y axis corresponding to normalized absorbance and the x axis corresponding to time subsequent to photodissociation. The traces are color-coded as follows: wild-type trHbN in green, the Tyr(B10)Phe/Gln(E11)Val double mutant in red, the Tyr(B10)Phe single mutant in black, and the Gln(E11)Val single mutant in blue. All the samples except the double mutant are in solution phase at pH 7.5. The trace from the double B10/E11 mutant (red) is from a sample encapsulated in a thin porous sol-gel bathed in buffer. Essentially identical kinetics were obtained for the solution phase sample of the double B10/E11 mutant, but due to the low concentration of the sample that trace was of poor quality. N. A., normalized absorbance.

