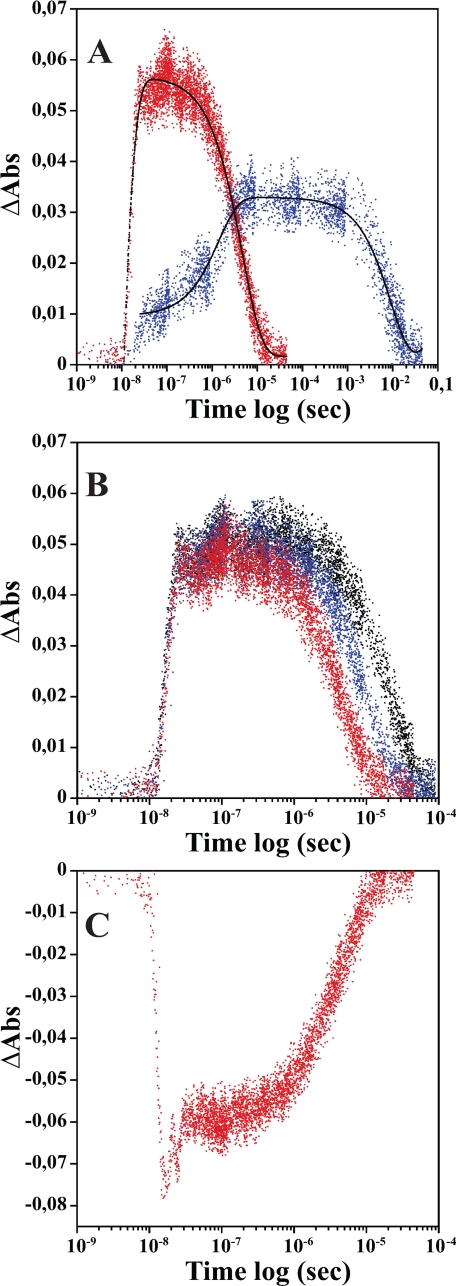
FIGURE 5.
Kinetic traces illustrating the absorbance changes after photodissociation of trHbN(Fe3+-NO) and Mb(Fe3+-NO) at 23 °C. Panel A shows the absorbance (Abs) changes corresponding to the water coordination processes followed at 408.5 nm (red) for trHbN(Fe3+-NO) (8.31 μm in heme) and 410 nm (blue) for Mb(Fe3+-NO) (7.37 μm in heme) preequilibrated with 100% ·NO. The solid lines are the results of the exponential fits (black). Panel B shows the kinetic traces acquired at 410 nm for trHbN(Fe3+-NO) (9.6 μm in heme) preequilibrated with 25% (black), 50% (blue), and 100% (red) ·NO. Panel C shows kinetic traces obtained at 421 nm after photolysis of trHbN(Fe3+-NO) (8.31 μm in heme) preequilibrated with 100% ·NO.

