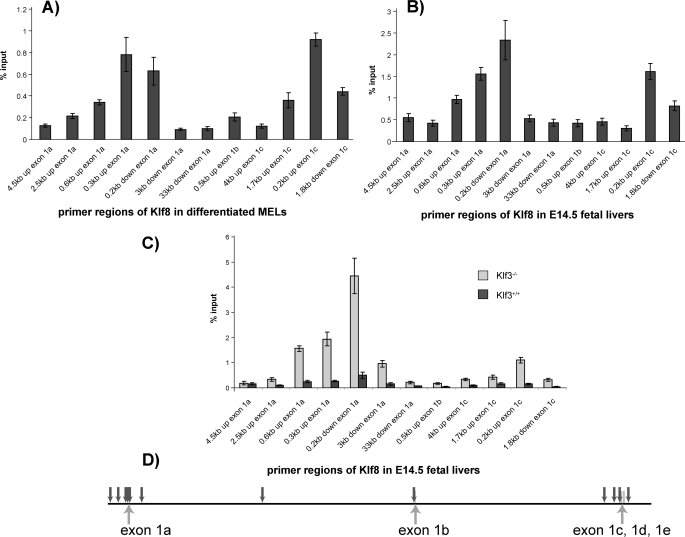
FIGURE 8.
ChIP of promoter regions of Klf8. A and B, Klf3 at Klf8 promoter regions in differentiated MEL cells (A) and E14.5 fetal liver cells (B). C, Klf1 at Klf8 promoter regions in Klf3–/– and Klf3+/+ E14.5 fetal livers. Real time PCR analysis of genomic DNA immunoprecipitated by Klf3 or Klf1 antibody during ChIP. Primer regions refer to the area of the Klf8 locus that was amplified. The ChIP signal was normalized against input control and then normalized again with respect to the 4.5 kb upstream of exon 1a signal, which was set at 1. A shows an average of 8 ChIP experiments, B shows an average of four ChIPs for each of three different pooled litters, and C shows an average of 2 ChIPs for three or four embryos for each genotype. The error bars show S.E. D, schematic diagram showing the location of ChIP primers as downward arrows with respect to exons across the Klf8 locus with distances to scale.

