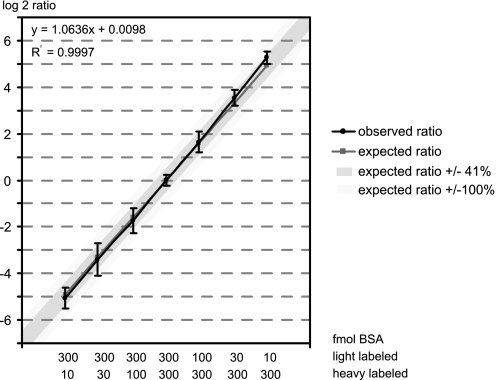
Fig. 3.
Linearity of the online double stable isotope labeling procedure. Plotted is the correlation between the expected (x axis) and determined (y axis) ratio for several online labeling experiments involving different amounts of BSA, as indicated below the graph. The ratios are calculated from the 10 most intense peptide peak pairs of each analysis. Plotted are the log 2 values of the actual ratios, with the pink line (squares) indicating the expected ratios and the blue line (circles) the observed ratios. The dark blue shading indicates the spread of 0.5 log units from the expected value and the light blue shading a spread of 1 log unit. Bars indicate the standard deviation between the ten quantified peptides for each sample.

