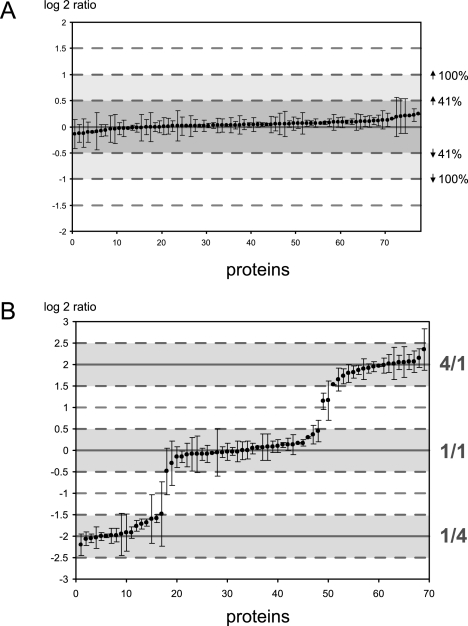
Fig. 4.
Quantified ratios from mouse lung tissue proteins. Indicated on the x axis are the number of proteins that were identified from several gel bands that were mixed either all in a 1:1 ratio (panel A) or with several gel bands mixed in different ratios (panel B). Ratios are calculated for all proteins from which at least two peptides were found that could be quantified and are plotted as the log 2 of the determined ratio. Shaded in blue, red, and green are the spread of 0.5 log units from the expected 1:1, 4:1, and 1:4 ratios, respectively. Bars indicate the standard deviation between the quantified peptides for each protein.

