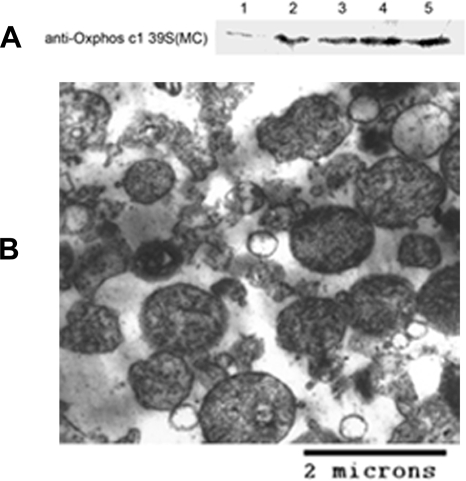
Fig. 1.
Evaluation of mitochondria fraction. A, Western blotting analysis of mitochondria enrichment. 15 μg of the liver homogenate and mitochondria proteins were separated by 12.5% SDS-PAGE and transferred to PVDF membranes. The blots were probed with an antibody against a mitochondria protein, Oxphos complex I 39-kDa subunit. 1 represents liver homogenate; 2, 3, 4, and 5 represent mitochondria fractions from SAMR1-1m, SAMP8-1m, SAMR1-6m, and SAMP8-6m, respectively. B, electron micrograph of isolated mitochondria from SAMP8-6m. Thin sections were stained with uranyl acetate and lead citrate. Scale bar, 2 μm.

