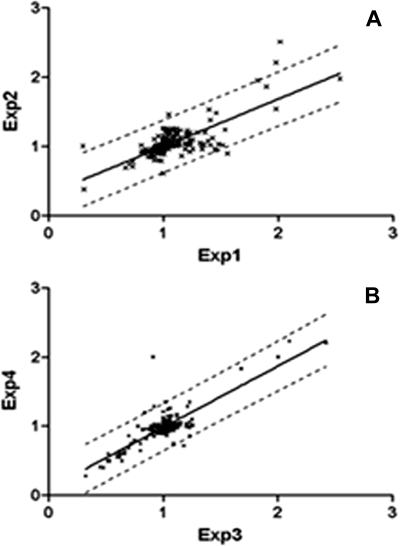
Fig. 3.
Scatter plots obtained from orthogonal labeling in 1-month-old mice (A) and 6-month-old mice (B). The SAMP8/SAMR1 ratio of each identified protein from Experiment 1 (Exp1) or Experiment 3 (Exp3) (SAMR1 labeled with the light chain) is plotted on the x axis, and that from Experiment 2 (Exp2) or Experiment 4 (Exp4) (SAMP8 labeled with the light chain) is plotted on the y axis. The dashed line indicates a linear regression with 95% confidence.

