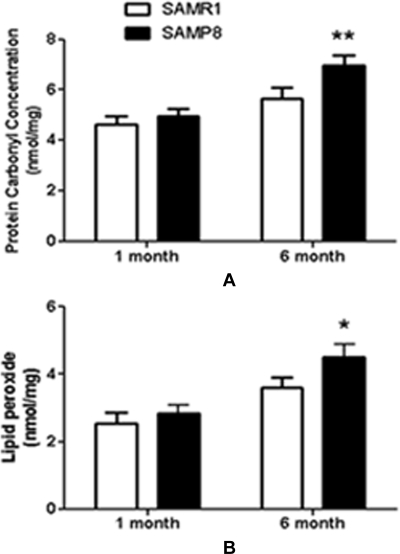
Fig. 8.
Comparison of protein and lipid oxidation levels in SAMP8 and SAMR1. A, the average carbonyl content of liver proteins from SAMR1 and SAMP8. B, the average lipid peroxide content in the liver from SAMR1 and SAMP8. All data presented are the mean ± S.E. value of five independent experiments; *, p < 0.05; **, p < 0.01.

