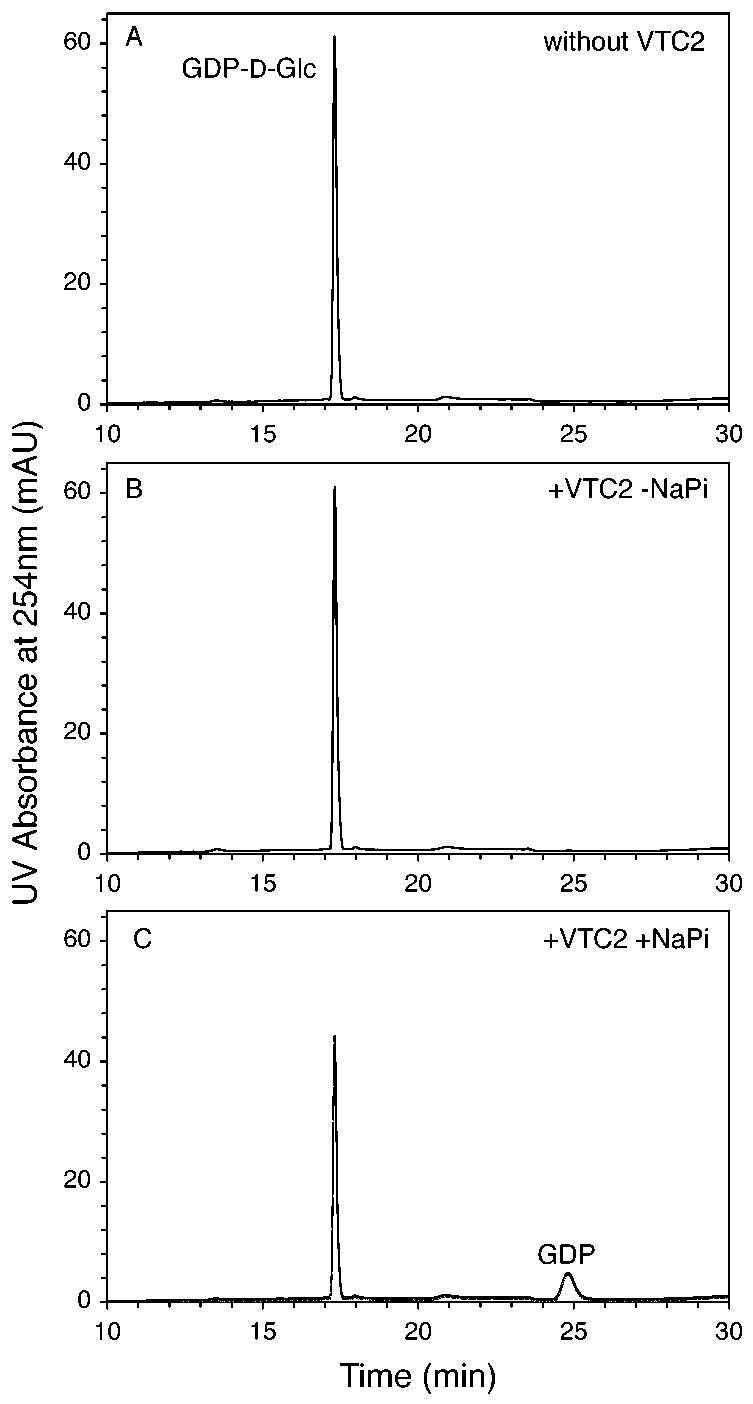
Fig. 3. VTC2-catalyzed phosphorolysis of GDP-l-Gal and formation of GDP.

GDP-d-Man was preincubated for 30 min with GME and 5 mM sodium phosphate as described in Fig. 2. After removal of heat-inactivated (3 min at 98 °C) GME, GDP-hexose consumption and GDP formation were monitored after incubation for the indicated times with VTC2 (6.5 ng/ml). Deproteinized reaction mixtures were analyzed by reverse-phase HPLC (panels A—C) as described in Fig. 2 and anion-exchange HPLC (100 μl samples, panels E—G) as described in the “Experimental Procedures” section. A small amount of GDP (less than 1% of the total GDP-hexose pool) was detected at 0 min as a VTC2-independent hydrolysis product. The HPLC traces shown are representative of three separate experiments. In panels D and H, the concentrations of GDP-d-Man, GDP-l-Gal, GDP-l-Gul and GDP are given as means ± standard deviations calculated from these experiments. Only error bars exceeding the symbol sizes are represented.
