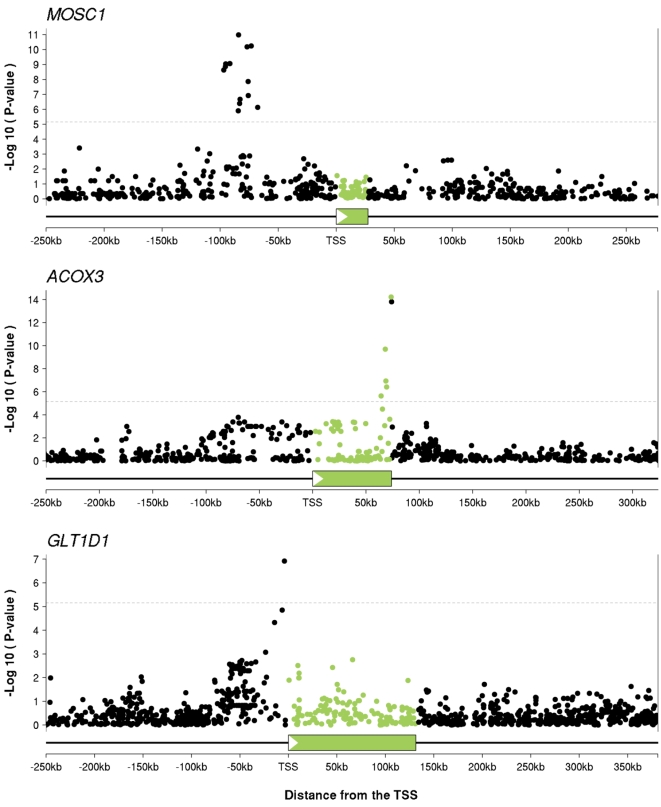
Figure 1. SNP association data often allow relatively precise localization of cis-eQTL signals.
The plots show examples of eQTLs for three genes: MOSC1, ACOX3 and GLT1D1. The x-axis on each plot indicates distance from the transcription start site. The transcribed regions are indicated by the green boxes and in all three plots the direction of transcription is left-to-right. For each SNP we plot the −log10(p-value) for association between genotype at that SNP and expression level of the gene. We use green to indicate SNPs that lie within the transcript of interest, and black for SNPs outside the transcript (this coloring is used for all the figures). The dotted line indicates the threshold for a gene-level FDR of 5% (p = 7×10⁻⁶).

