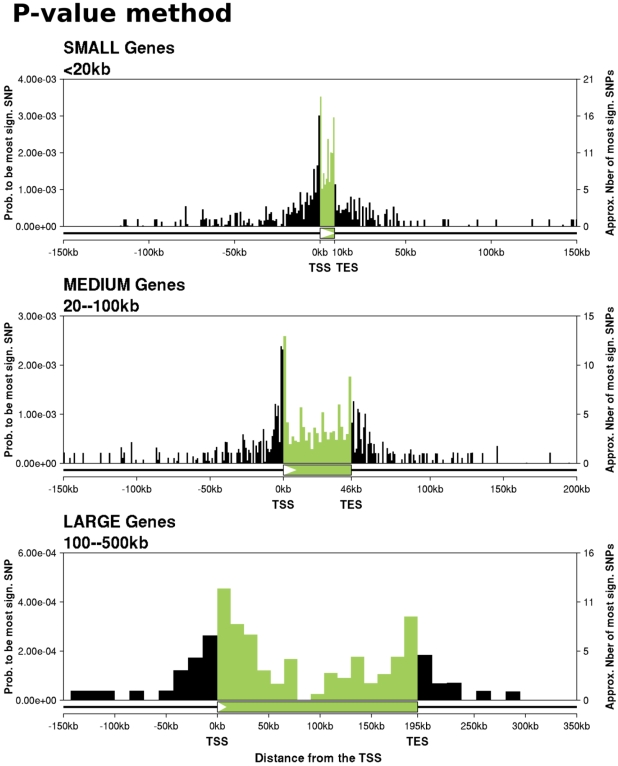
Figure 2. Locations of the most significant eQTL SNPs for small, medium, and large genes.
Each plot shows, for genes with an eQTL, the distribution of locations of the most significant SNP. The x-axis of each plot divides a typical cis-candidate region into a series of bins as described. The y-axis plots the number of SNPs in each bin that are the most significant SNP for the corresponding gene and that have a p-value <7×10⁻⁶ divided by the total number of SNPs in that bin. The plotted data include an adjustment for the effect of unknown SNPs inside probes (Methods). SNPs outside genes are assigned to bins based on their physical distance from the TSS (for upstream SNPs), or TES (downstream SNPs). SNPs inside genes are assigned to bins based on their fractional location within the gene. There are 5372 “small” genes, of which 300 have an eQTL, 4489 medium genes (347 eQTLs), and 1585 large genes (94 eQTLs). The size of the schematic gene at the bottom of each plot indicates the average transcript length for that set of genes.

