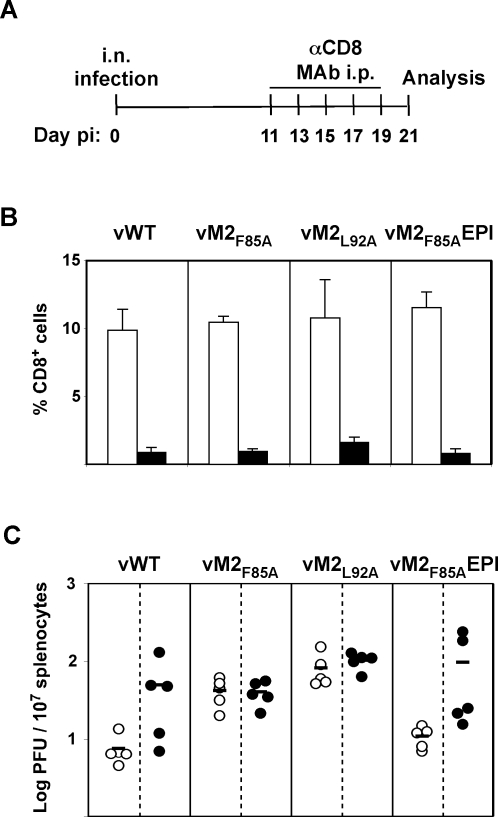
Figure 4. M284–92 epitope expression and CD8+ T cells are linked in setting splenic latent loads.
BALB/c mice were intranasally infected with the indicated viruses (104 PFU) and at 11, 13, 15, 17 and 19 days post-infection anti-CD8 monoclonal antibody (MAb) was intraperitoneally injected. At 21 days post-infection spleens were removed for analysis. Control mice are d21 infected littermates that were not injected with MAb. A. Schematic diagram of the experimental setting. B. Splenocytes were stained for CD8. The data show the percentage of CD8+ T cells of total lymphocytes (arithmetic means±STDV) in depleted mice (black bars) and control mice (white bars). C. Splenocytes were titrated for reactivation-competent virus by explant co-culture. Each point shows the titre of one mouse. Black symbols represent data for CD8+ T cell depleted mice, white symbols represent data for control mice. Horizontal lines indicate arithmetic means. Data were reproducible over two independent experimental groups.

