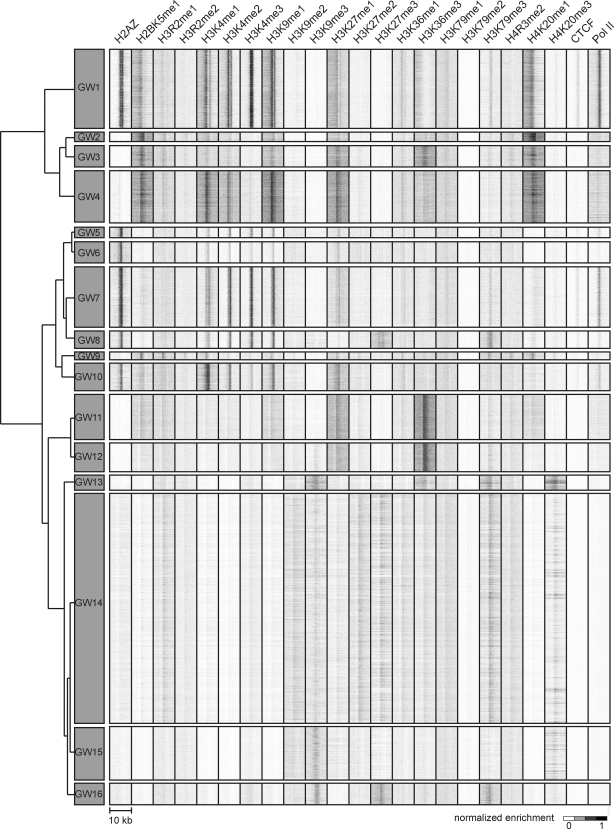
Figure 8. ChromaSig clusters recovered from 21 histone marks mapped by ChIP-Seq in CD4+ T cells genomewide.
ChromaSig recovers 16 clusters spanning 49340 genomic loci. Each cluster is represented by a heatmap summarizing ChIP-Seq enrichment for all loci in the cluster. The window size for each mark is 10-kb. To organize these clusters visually, we use hierarchical clustering with a Euclidean distance metric (left).

