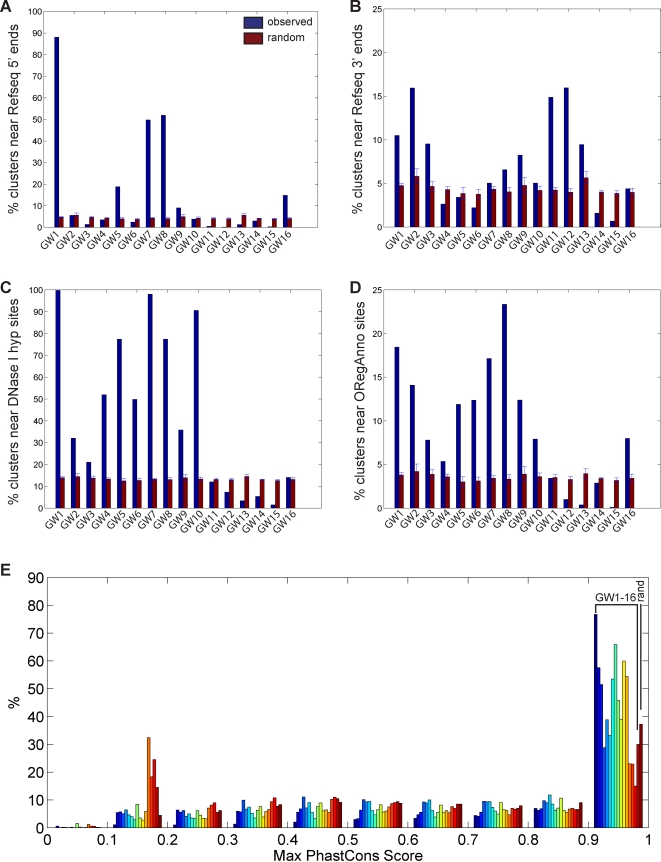
Figure 9. Overlap of genomewide clusters with known annotations.
Percentage of each cluster within 2.5-kb of (A) 21211 Refseq 5′ ends [23], (B) 20754 Refseq 3′ ends [23], (C) 95709 DNase I hypersensitive sites mapped in CD4+ T cells [29], and (D) 21959 regulatory sites from the ORegAnno database [30], as compared to 100 sets of random sites. (E) Distribution of maximum PhastCons scores [25] over a 1-kb window centered at ChromaSig aligned sites, as compared to 10000 random sites.

