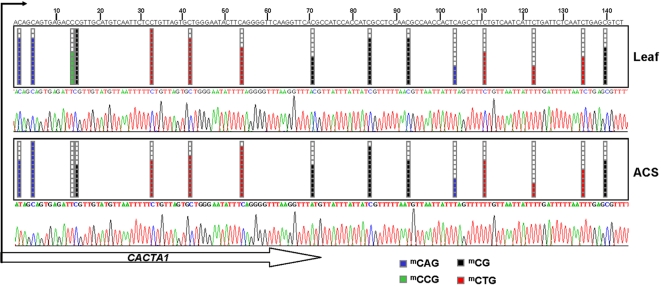
Figure 4. Bisulfite genomic sequencing of twelve individual clones of the repeat DNA CACTA in leaves and Arabidopsis cell suspension (ACS).
Black and white dots indicate methylated and unmethylated CpGs, respectively. Methylation at CAG, CG, CCG, and CTG sites is represented by blue, black, green, and red boxes, respectively. The lower panels illustrate representative electropherograms.

