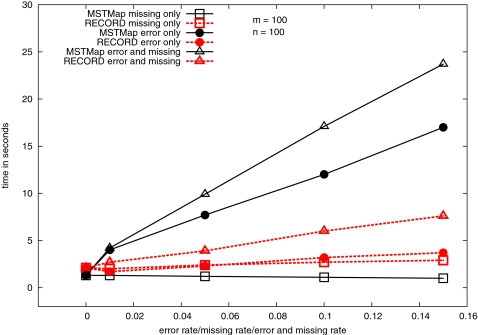
Figure 4. Running time of MSTmap and Record with respect to error rate or missing rate or error and missing rate.
Every point in the graph is an average of 30 runs. The lines “missing only” correspond to data sets with no error (η = 0, γ is on the x-axis). Similarly, lines “error only” correspond to data sets with no missing (γ = 0, η is on the x-axis), and lines “error and missing” correspond to data sets with equal missing rate and error rate (η = γ is on the x-axis).

