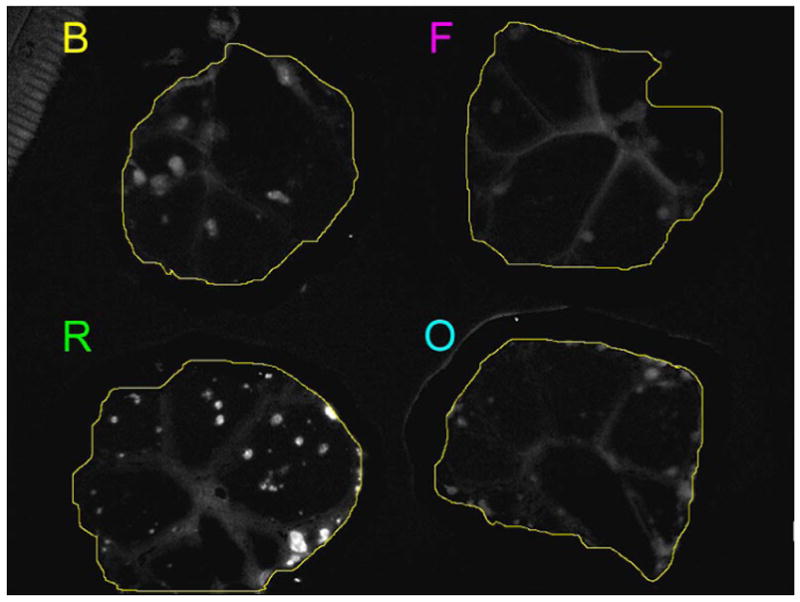
Figure 6.


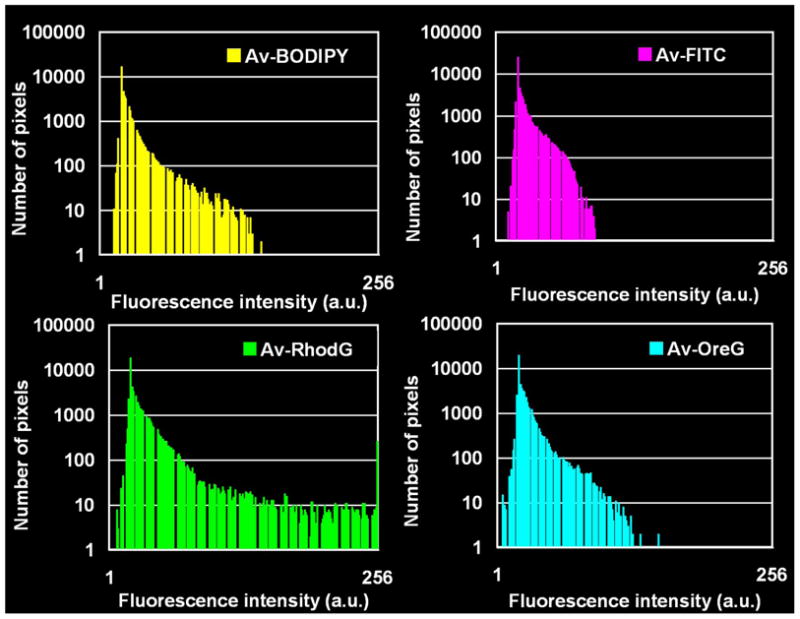
Semi-quantitative assessment of in vivo fluorescence intensity. a: ROI was drawn inside the intestine on the unmixed green fluorescence image (the same image as the unmixed green fluorescence image of Figure 5). B: Av-BODIPY. F: Av-FITC. O: Av-OreG. R: RhodG. b: Histogram of fluorescence intensity of an ROI drawn on each of the peritoneal membranes instilled with 4 green dyes, Av-BODIPY, Av-FITC, Av-OreG and RhodG. The dynamic range of the fluorescence intensity was split into equal-sized 256 bins (1–256). Then for each bin (horizontal axis), the number of pixels from the data set that fall into each bin (vertical axis) are counted. The shape of the plot distribution ≤40 in arbitrary unit (a.u.) is almost the same among the 4 histograms.
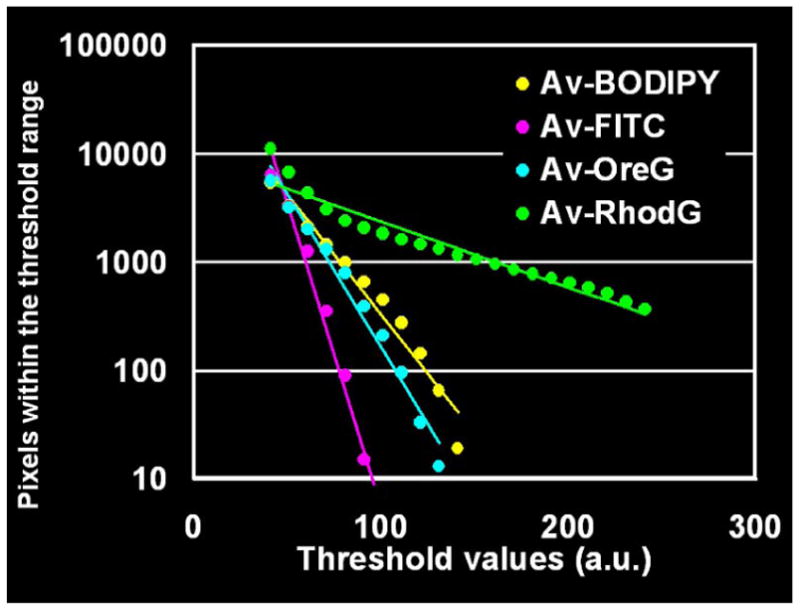
c: Regression lines of 4 green dyes. The regression lines were calculated from the data sets (fluorescence threshold values 41–241, total number of pixels within the threshold rage 10–100,000 in common logarithm). The slopes of Av-BODIPY, Av-FITC, Av-OreG and Av-RhodG were -0.022, −0.056, −0.028 and −0.006, respectively. Av-RhodG has the highest slope value consistent with it being the brightest fluorophore whereas, Av-FITC had the lowest slope value, and Av-BODIPY and Av-OreG were intermediate.
