
Figure 4. EPR spectram of 1.6 mM ETHE1 under different conditions.
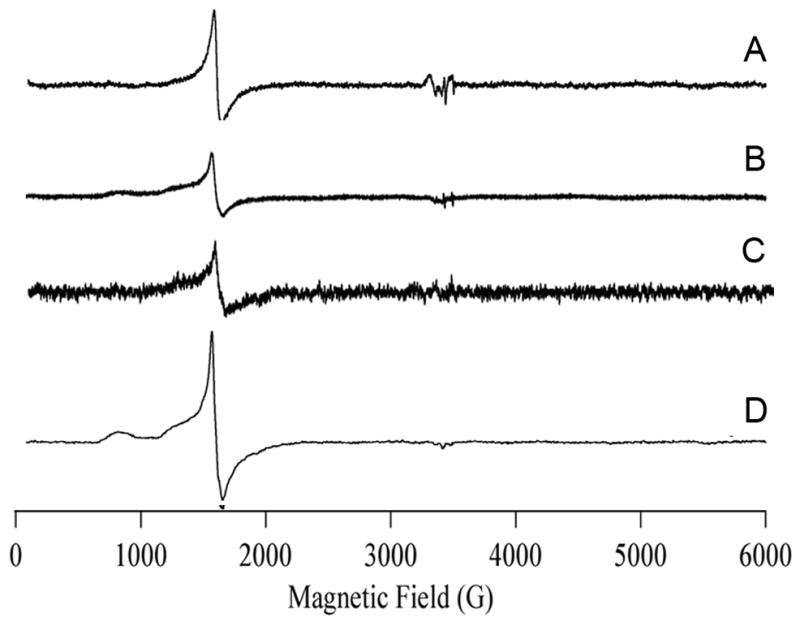
A, ETHE1 as-isolated containing 0.33 equivalents of Fe; B, iron-enriched ETHE1 containing 1.2 equivalents of Fe; C, iron-enriched ETHE1 after 2 cycles of freeze/thaw; D, iron-enriched ETHE1 after 4 days at 4º C. Spectra were collected on a Bruker ESP-300E spectrometer containing an ESR-900 helium flow cryostat operating at 4.7 K with 2 milliwatts of microwave power at 9.48 GHz and 10 G-field modulation at 100 kHz.