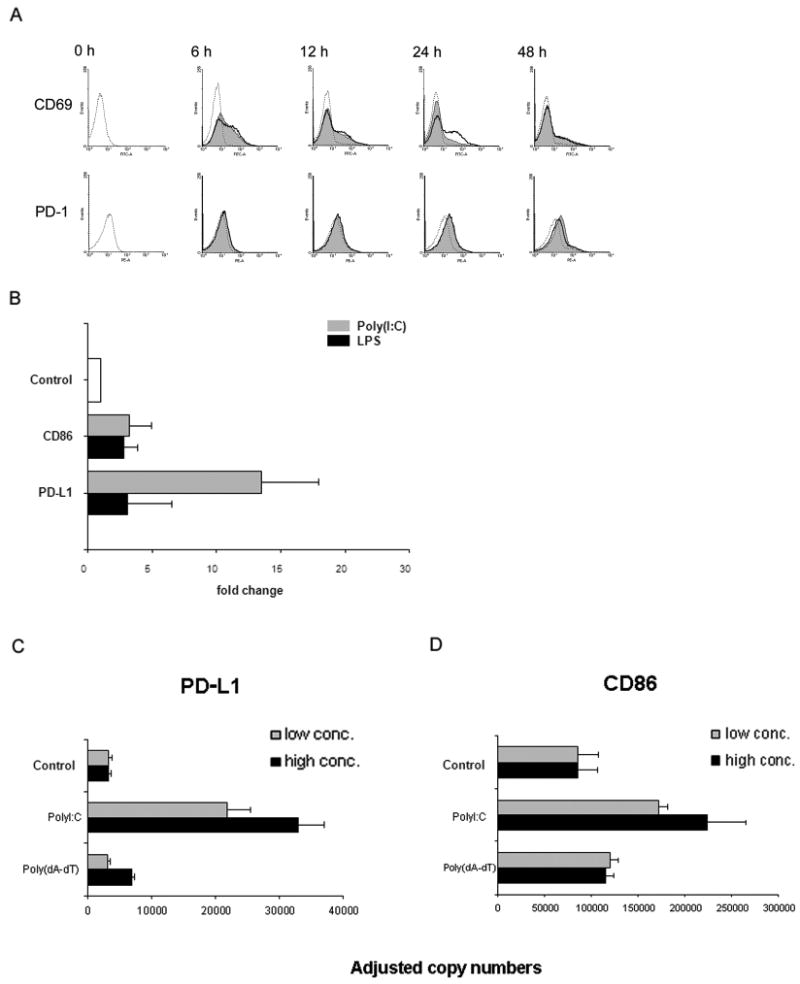
Figure 4. Poly(I:C) stimulation preferentially induces the co-inhibitory ligand PD-L1.

(A) Freshly isolated T cells were cocultured with TLR-stimulated DCs [poly(I:C) 100 μg/mL and LPS 1 μg/mL], and expression of the activation markers CD69 and PD-1 on CD4+ T cells was determined by flow cytometry at the indicated time points. Representative histograms of control cultures (dashed lines), cultures including poly(I:C) (shaded areas), or LPS (bold lines) are shown. Early activation events are indistinguishable but after 24 hours, LPS-triggered DCs mediate stronger CD69 expression than poly(I:C)-stimulated DCs. Induction of the co-inhibitory receptor PD-1 expression was similarly efficient by poly(I:C)- and LPS-stimulated DCs and peaked at 24 hours. (B) Dendritic cells were stimulated with TLR ligands poly(I:C) or LPS, and mRNA was harvested after 6 hours. Expression of PD-L1 and CD86 transcripts was assessed by quantitative PCR. Results are presented as mean±SD relative to transcription level of unstimulated DC and are representative of 3 independent experiments. CD86: Control versus LPS-stimulated (1 μg/mL) DC, P=0.04; Poly(I:C)-stimulated (100 μg/mL) DC versus LPS-stimulated (1 μg/mL) DC, P > 0.05. PD-L1: Poly(I:C)-stimulated (100 μg/mL) DC versus LPS-stimulated (1 μg/mL) DC, P = 0.01. (C and D) DC were stimulated with poly(I:C) or the RIG-I-like receptor ligand poly(dA-dT) for 4 hours, and transcript levels for PD-L1 (left) and CD86 (right) were quantified by qPCR. Two concentrations of each ligand were used: 25 and 100 μg/mL of poly(I:C) and 0.01 and 1 μg/mL of poly(dA-dT). Representative results from one of two independent experiments are shown as mean ± SD. PD-L1: Control versus poly(I:C)-treated DC (25 μg/mL), P=0.007; control versus poly(dA-dT)-stimulated DC (0.01 μg/mL), P=0.4. CD86: Control versus poly(I:C)-treated DC (25 μg/mL), P<0.01; control versus poly(dA-dT)-stimulated DC (0.01 μg/mL), P =0.07.
