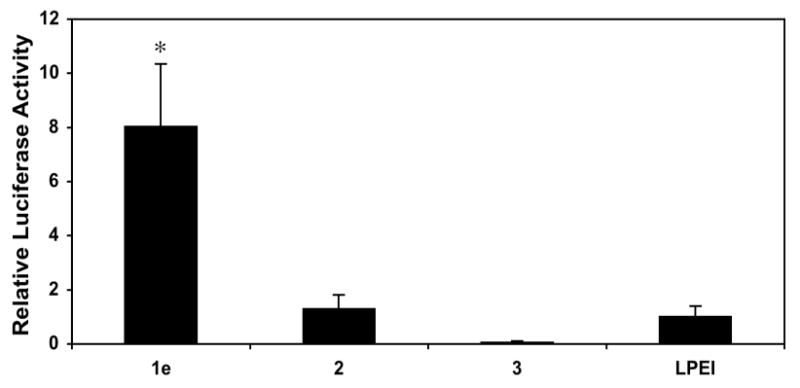
Figure 2.

Plot of relative levels of normalized luciferase expression in COS-7 cells mediated by polyplexes formulated using polymers 1e, 2, 3, and LPEI. Relative levels of expression are normalized to the transfection efficiency of LPEI. Transfection experiments were conducted in replicates of three the manner described for data collected in Figure 1. Values of normalized luciferase expression used correspond to those obtained using the DNA/polymer ratio (w/w) determined to mediate the highest levels of transfection for each polymer (1:1 for polymers 1e, 3, and LPEI; 1:3 for polymer 2) and are reported as averages with standard deviation. Results are presented as an average of three experiments ± standard deviation. Results marked with an asterisk (*) indicate results determined to be statistically different from all others (p<0.05) using Student's t-test.
