
Figure 5.
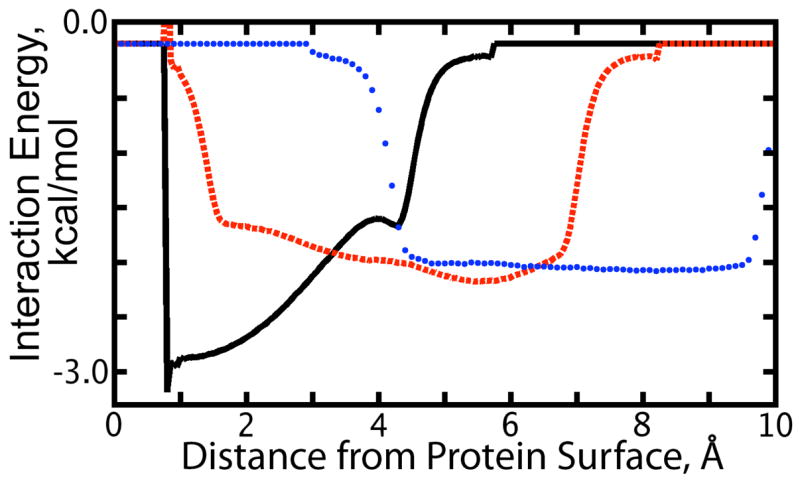
(Color online.) Average interaction energy of a water molecule located at 1.7 Å (black, solid line), 4.4 Å (red, dashed line), and 7.0 Å (blue, dotted line) from the surface of the uncharged protein with nearby water molecules at other distances from the protein van der-Waals surface as indicated by the x-axis. These graphs show the local interaction characteristics of the first and second solvation shells, and deep solution, respectively.