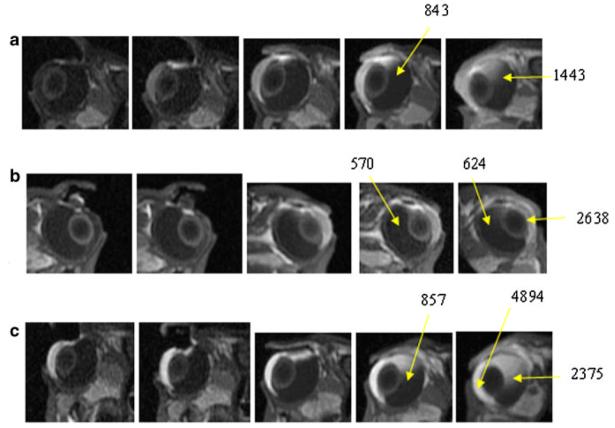
Figure 4.
Representative MR images of postmortem transscleral iontophoresis experiment of 2 mA of (a) 0.1 M MnEDTA2−, (b) 4 mM Mn2+, and (c) 40 mM Mn2+ in Experiment C. From left to right, images obtained at (a) 9 and 19 min during iontophoresis, and 10, 55 and 140 min after iontophoresis, (b) 10 and 19 min during iontophoresis, and 40, 60, and 190 min after iontophoresis, and (c) 9 and 18 min during iontophoresis, and 10, 60, and 140 min after iontophoresis. Note that high Mn2+ and MnEDTA2− concentrations such as 40 mM Mn2+ and 0.1 M MnEDTA2− in the electrode device are represented by dark voxels in the images due to the parabolic signal versus concentration relationship. The numbers indicate the MR signals from the region of interest (average of 9 voxels or 4 mm3).

