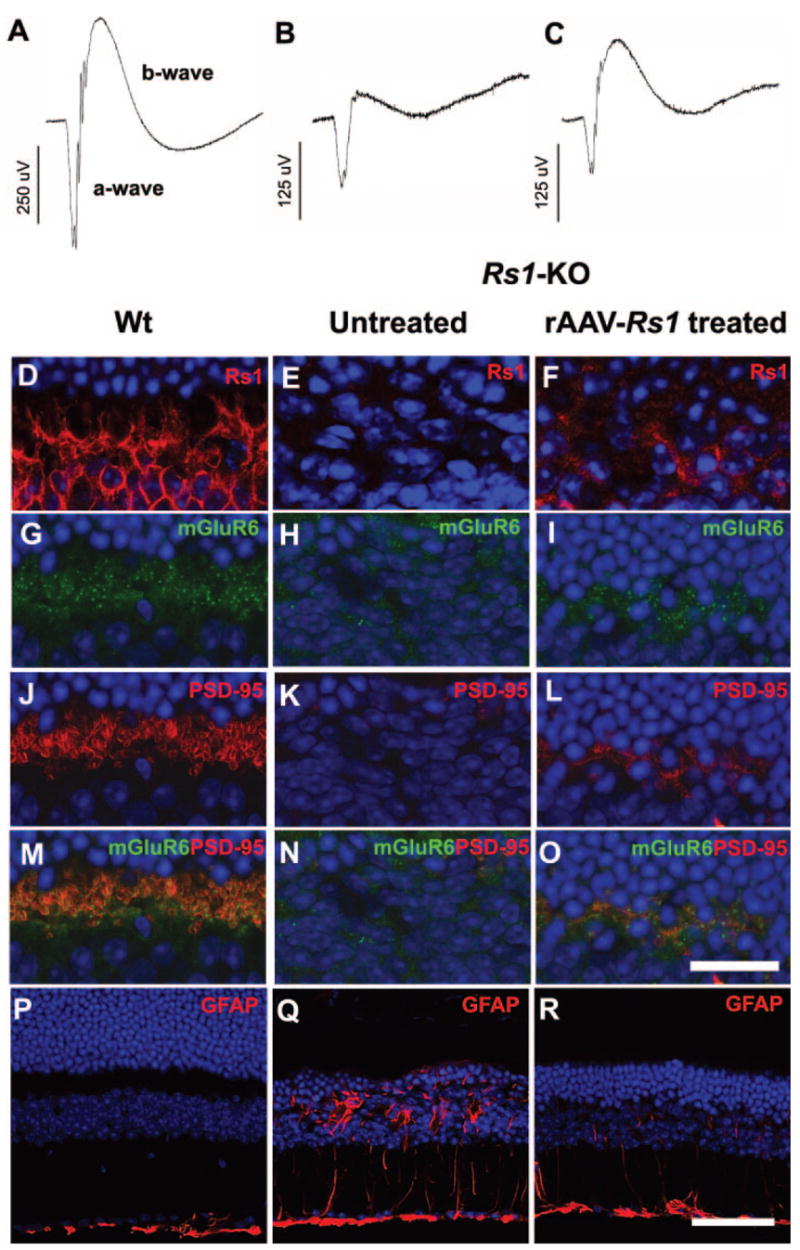
Figure 8.

ERG retinal function and synaptic structure after Rs1 gene delivery to Rs1-KO retina. Representative dark-adapted ERG waveforms from an 8-month-old Rs1-KO mouse after gene delivery (B, C) show a larger b-wave in the treated eye, although it remains smaller than in Wt (A). Stimulus intensity = 0.6 log cd-s/m2. Expression of Rs1 (red) was seen in the OPL of Wt retina (D) and rAAV-Rs1 treated eye of the Rs1-KO mouse (F) but not in the untreated eye (E). Gene delivery elevated the expression levels of mGluR6 (green) and PSD95 (red) in OPL of the Rs1-KO retina (I, L, O) compared with the untreated fellow eye (H, K, N). Labeling of Wt retina for mGluR6, PSD95, and both mGluR6 and PSD95 is shown in (G), (J), and (M), respectively. Expression of GFAP (red) (P), was restricted to the inner limiting membrane in Wt but spanned the retina of Rs1-KO (Q). rAAV-mediated Rs1 gene delivery retina showed reduced GFAP protein expression (R). Scale bar: (D–O) 25 μm; (P–R) 75 μm.
