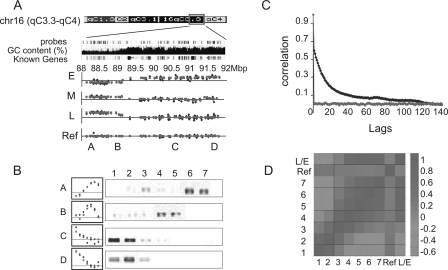
Figure 2.
Genome-wide measurements of the time of replication. (A) A large genomic region (4 Mb) of chromosome 16 is shown along with the probes of the Agilent aCGH microarray, its GC content, and the “Known Genes” track (taken from the UCSC Genome Browser). BrdU enrichment raw (blue) and processed (red; see Methods) data is shown for samples 1,3,6 and the control experiments (E, M, L, and ref, respectively). A, B, C, and D mark the regions that were validated in B. (B) BrdU enrichment, as measured by the arrays (left; red and blue as in A) and by semi-quantitative PCR (right) for regions A–D. Note strong agreement between the data from the microarray and the gene-specific validation. (C) Autocorrelation of all probes in sample 1, with their neighboring probes sorted by their chromosomal position (red) or location on the array (blue) at increasing distances (lag). Similar results were obtained for all seven samples (Supplemental Figure S1). Note that strong correlation is observed for up to at least 100 neighboring sequences (lag = 100). However, no significant autocorrelation is evident for data sorted by array location. (D) Pearson correlation was calculated between each pair of samples. L/E represents a control experiment in which sample 6 was hybridized against sample 1. Note the high correlation around the diagonal, demonstrating the positive correlation between neighboring fractions.

