
Figure 4.
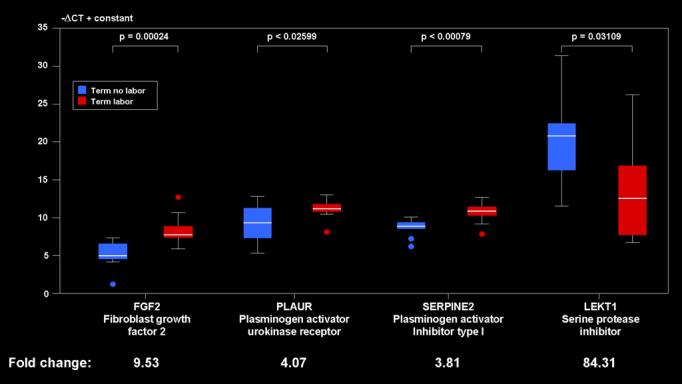
qRT-PCR results for FGF2, PLAUR, SERPINE2, and LEKT1 The boxes encompass 50% of the data from the 1st quartile up to the 3rd quartile. The middle line represents the median value (50% quantile). The whiskers extend to the most extreme data point which is no more than 1.5 times the inter-quartile range from the box.