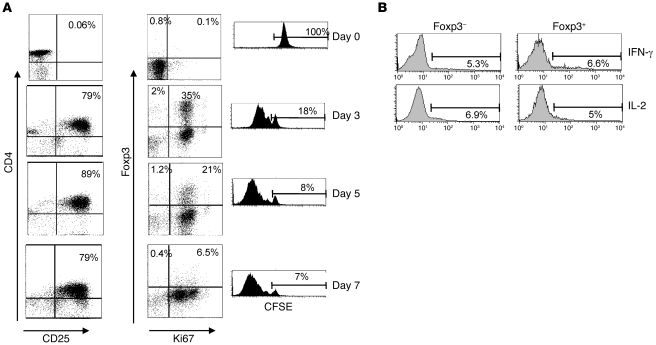
Figure 4. Induction of Foxp3 expression in human CD4+CD25– T cells by stimulation.
(A) CD4+CD25– (responder) T cells were isolated from PBMCs using MACS and labeled with CFSE. Cells were stimulated with magnetic beads coated with antibodies to CD3 and CD28 for 7 days. Samples were removed at regular intervals and stained for the expression of CD25, Foxp3, and Ki67. Numbers in dot plots indicate the percentage of cells in each quadrant. Dilution of the CFSE signal indicates proliferation of the cells. Percentages refer to cells that have not divided. Data shown are representative of 3 independent experiments. (B) Cells were removed from CD3/CD28-stimulated cultures on day 4 and restimulated with PMA and ionomycin before staining for Foxp3, IL-2, and IFN-γ. Histograms show cytokine production by Foxp3– and Foxp3+ cells and are representative of 3 independent experiments. Numbers indicate the percentage of cells expressing IL-2 or IFN-γ.

