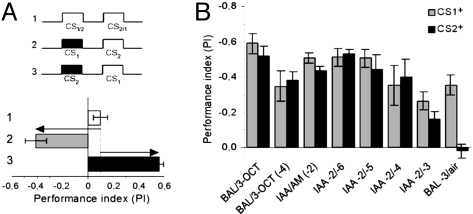
Fig. 3.
Half-scores. (A) Protocols (Upper) and schematic calculation of half scores (Lower). Distribution of naive flies between CS1 and CS2 in the test is set to be around PI ≈ 0 (protocol 1). Flies shocked in the presence of CS1 (protocol 2; gray bars in B) avoided it in the test. Shock paired with CS2 (protocol 3; black bars in C) led to the avoidance of CS2. For half-scores responses of naive flies are subtracted from PIs (arrows). (B) Both half-scores (e.g., after punishing CS1 or CS2) are plotted upward and negative here (in contrast to A) to make them easily comparable. Their contribution to the final learning score is similar, both for two odorants and two concentrations of one odor. The only exception is air, because no association is formed with air.

