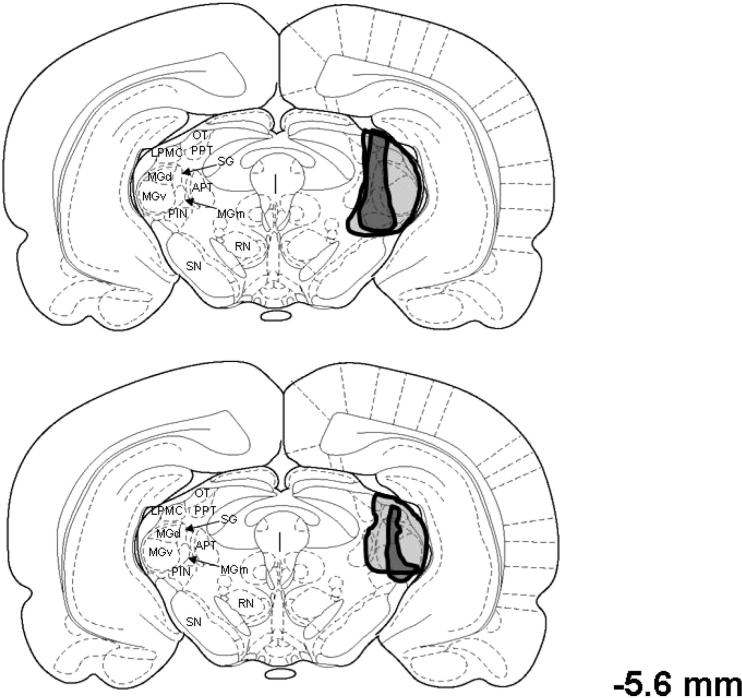
Figure 2.
Drawing of coronal sections of the rat brain depicting the smallest (black regions) and largest (gray regions) lesions in rats with complete (upper) or incomplete (lower) lesions of the medial auditory thalamus, which includes the medial division of the medial geniculate (MGm), the posterior intralaminar nucleus (PIN), and the suprageniculate (SG). APT = anterior pretectal nucleus; LPMC = lateral posterior thalamic nucleus, mediocaudal division; MGd = dorsal division of the medial geniculate; MGv = ventral division of the medial geniculate; OT = optic tract nucleus; PPT = posterior pretectal nucleus; RN = red nucleus; SN = substantia nigra. The number to the right of the drawings indicates the anterior–posterior stereotaxic coordinate relative to bregma. From The Rat Brain in Stereotaxic Coordinates (Figure 42) by G. Paxinos and C. Watson, 1998, New York: Academic Press. Copyright 1998 by Academic Press. Adapted with permission.

