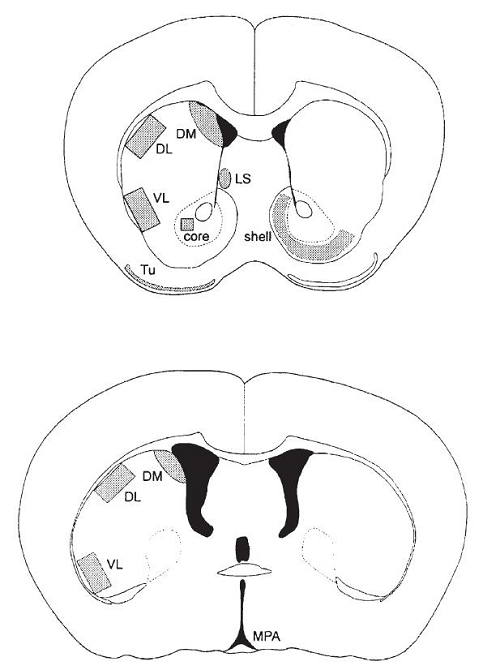
Figure 1.

Schematic representation of the forebrain regions where NT mRNA hybridization signal was measured at the rostral (bregma 0.98 mm, top) and caudal (bregma −0.10 mm, bottom) striatal level of the mouse brain. DL, dorsolateral striatum; DM, dorsomedial striatum; MPA, medial preoptic area; VL, ventrolateral striatum; LS, lateral septum; Tu, olfactory tubercle.
