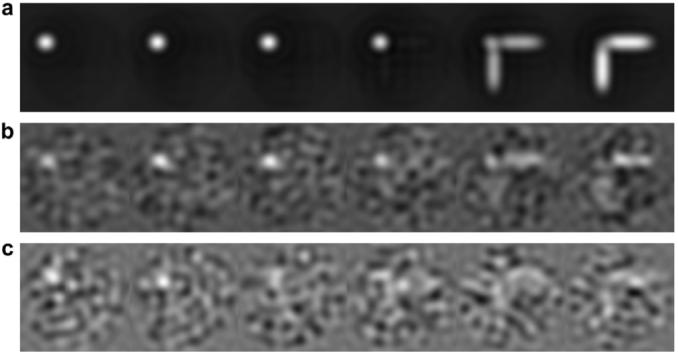
Fig. 6.

Reconstructions for the T1 phantom configuration using two different levels of noise. (a) Sequential slices of original T1 phantom. (b) Sequential slices of bandpass filtered reconstruction generated with noise added to 40 projections in ±60° range with SNR = 0.04 and random shifts of ±2.5 pixels. (c) Sequential slices of bandpass filtered reconstruction from 40 projections in ±60° range with SNR = 0.018 and ±5 pixel shifts.
