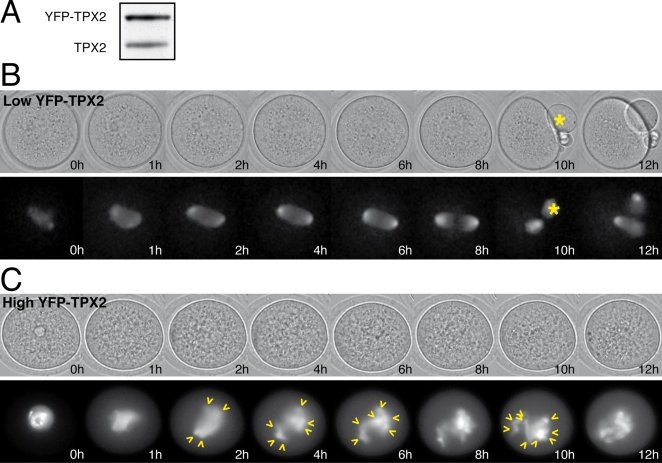
Figure 2. TPX2 overexpresssion induces an arrest in meiosis I.
A: Immunoblot analysis of endogenous (TPX2) and exogenous (YFP-TPX2) protein levels in metaphase II oocytes (n = 72) expressing low levels of YFP-TPX2. B and C: Representative time-lapse videomicroscopy of oocytes expressing low (B; n = 78) or high (C; n = 29) levels of YFP-TPX2. Upper panels are the bright field images of the oocyte and the lower panels show the fluorescent YFP signal at the corresponding time points (germinal vesicle breakdown is 0 h). While the polar body extrusion (asterisks) was normal in (B), it was blocked in (C). In this case, multipolar microtubules structures were observed (see arrowheads).

