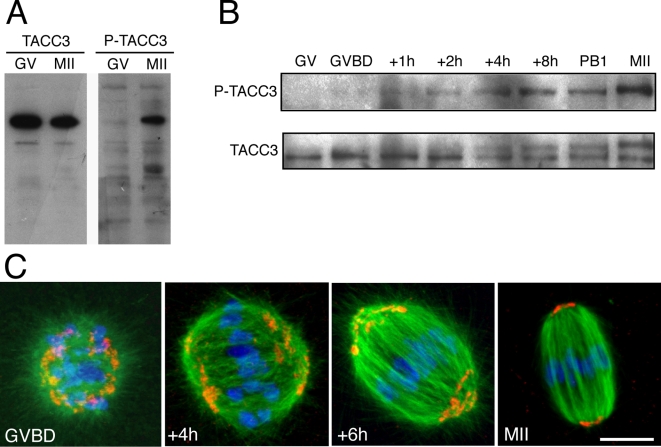
Figure 6. Characterization of TACC3 during mouse oocyte meiotic maturation.
A: Immunoblot analysis of TACC3 and phosphorylated TACC3 (P-TACC3) in GV and metaphase II (MII) oocytes. Oocytes (n = 150) were immunoblotted using an anti-TACC3 antibody (left) and an antibody raised against xTACC3 phosphorylated on Ser626 (right). B: Immunoblot analysis of TACC3 and P-TACC3 during meiotic maturation. Oocytes (n = 140) were immunoblotted at the indicated time points. C: Localization of P-TACC3 during meiotic maturation. Oocytes were triple stained for P-TACC3 (red), microtubules (green) and nucleic acids (blue). The P-TACC3 staining becomes restricted to the spindle poles during meiotic maturation. Scale bar is 10 µm.

