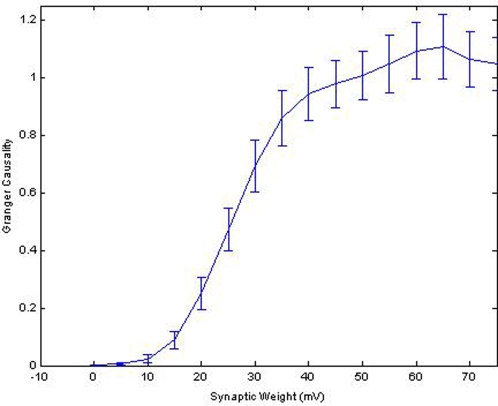
Figure 4. The Relationship Between the Causal Strength From Pairwise Granger causality and Actual Synaptic Weights.
The PGC results from a mono-directional simulation with the weight from neuron 4 to 5 varied from 0–75 mV in increments of 5 mV. Synaptic weight is plotted on the x-axis while the resulting PGC values calculated from the spike timing is plotted on the y-axis. The error bars represent the standard deviation of the results of 100 simulations for each point in the plot. The relationship between synaptic weight and PGC is sigmoid described by Equation 12. Notice that only the region in which the synaptic weights are between 15 mV and 45 mV is linearly related with the magnitude of the causality estimate. Areas in which the synaptic weights are very small or very large will result in a distorted causality value that changes very little.

