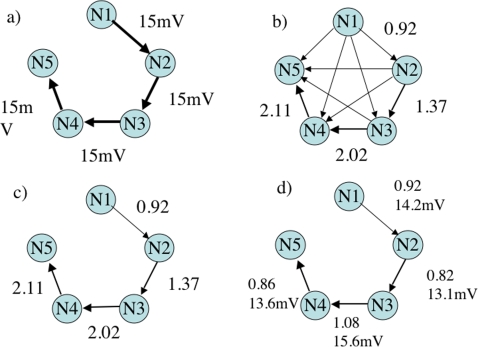
Figure 5. Application of Pairwise and Conditional Granger Causality Analysis to a Five-Neuron Serial Chain.
This was carried out where a) shows the synaptic weights before simulation. Calculation of PGC for all possible connections for the 5 neurons yields the plot shown in b). Notice that using PGC alone many new false connections are shown. When CGC is used to eliminate the false connection the plot is reduced to what is shown in c). After CGC plot c) begins to resemble the connectivity pattern as shown in a), however, the values associated with c) do not scale with the synaptic weights shown in a). A further step using CGC a second time or using Geweke's subtraction method is required to detangle direct and mediated influences. The results after the use of Geweke's subtraction method to calculate DGC are shown in d) along with corresponding approximations of synaptic weight.

