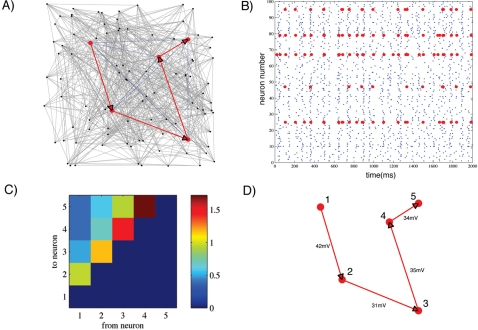
Figure 8. Recovery of Structural Information Using GC and CGC in a Biologically Plausible Complex 100-Neuron Network.
A chain of 5 neurons (shown in red) is embedded within a larger network of 100 neurons connected in an all-to-all fashion (grey lines where only a fraction of the total connections are shown for clarity). The goal of this simulation is to extract the causal core shown in panel A using Granger Methods. Each synaptic weight in the chain is is set at 40 mV. Panel (B) shows the activity of these five neurons within the full network. Panel (C) shows the results from only PGC analysis in which the causal serial relationship can be seen along the diagonal. Panel (D) shows the remaining significant connectivity after CGC analysis and their corresponding synaptic weights. Note that the weights down the chain are significantly underestimated, this is likely due to the influence of the rest of the network on recovered weights.

