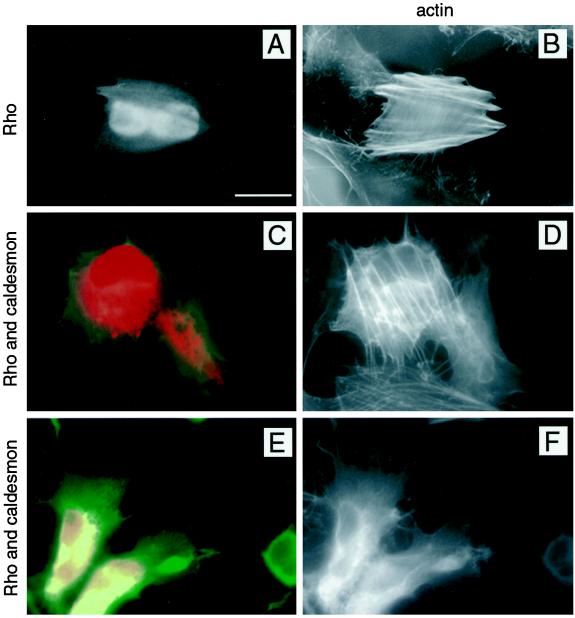
Figure 6.
Caldesmon interferes with Rho-induced enhancement of actin cable formation. (A and B) Cells transfected with activated Rho (Rho A-V14). Staining was performed with anti-tag antibody to visualize Rho A-V14 expression (A) and with phalloidin to visualize actin in the same cells (B). (C–F) Cells cotransfected with activated Rho and caldesmon. Triple staining was performed to visualize Rho, caldesmon, and F-actin in the same cultures. (C and E) Staining with antibodies to VSV and HA tag visualizing transfected Rho and caldesmon; intensities of staining are represented by pseudo colors: red corresponds to 100% Rho; green corresponds to 100% caldesmon; and intermediate orange–yellow colors correspond to different ratios between them. (D and F) Phalloidin staining of the same fields. Bar, 25 μm. Note that stress fibers in Rho-transfected cells (B) are much better developed than in neighboring (nontransfected) cells. The cells cotransfected with Rho and caldesmon assemble actin cables only if the level of Rho is much higher than the level of caldesmon (cell in the upper left part of C and D); if the level of caldesmon is comparable with that of Rho, formation of actin cables is blocked (cells in E and F).

