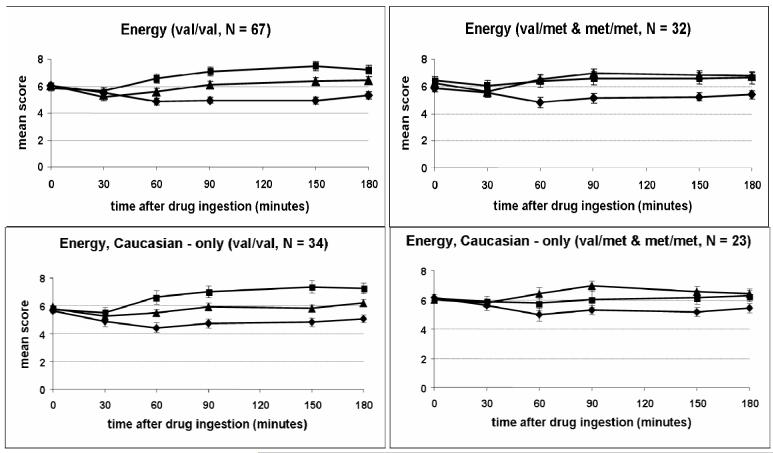
Figure 2.
Time course of self-reported energy (ARCI BG) after drug administration (placebo, 10 mg AMPH, 20 AMPH) for the two genotype groups (Drug*Group Effect: p = 0.018) and for Caucasian subjects only (Drug*Group Effect: p = 0.032). Data shown are mean (±SEM) ratings. ◆ = Placebo; ▲ = 10 AMPH; ■ = 20 mg AMPH.

