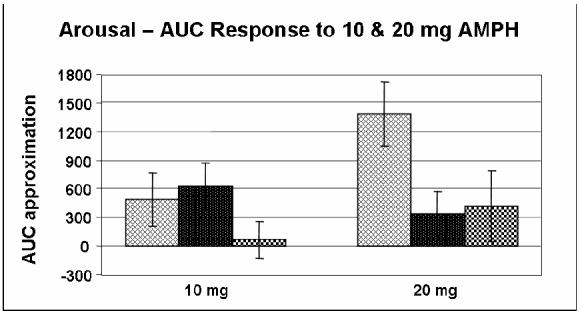
Figure 5.

Area under the curve (AUC) approximation of self-ratings of arousal (POMS) in response to 10 mg (p = 0.772) & 20 mg (p = 0.079) AMPH for Caucasian-only subjects in all three genotype groups ( = val/val;
 = val/met;
  = met/met). AUC was calculated relative to placebo. Data shown are the mean (± SEM) values.
