
Fig. 2.
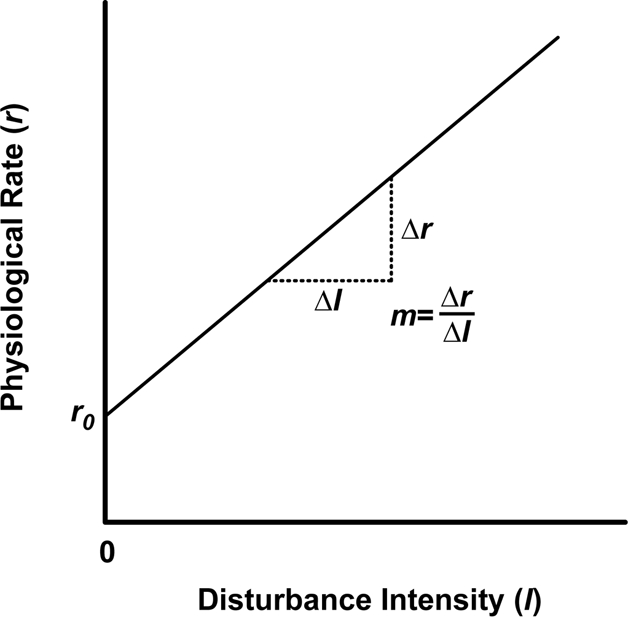
A physiological response curve for a microbial taxon. The curve illustrates the rate at which the taxon contributes to an ecosystem process as a function of disturbance intensity. For simplicity, this function is assumed to be linear, although other forms are likely for microbial taxa. The slope m of the line indicates how quickly the physiological rate changes with I, and r0 is the physiological rate in the absence of disturbance.