
Figure 5.
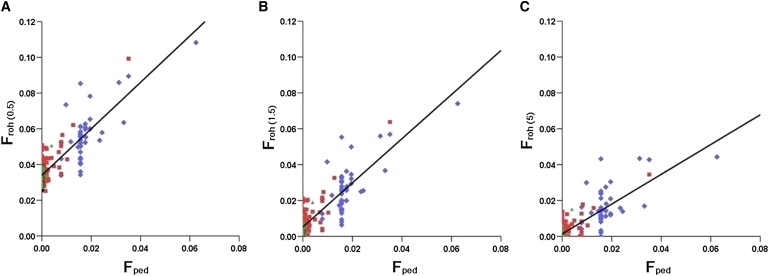
Correlation between Fped and Froh in Orkney Sample
Correlations, with regression lines, are shown for three different minimum-ROH-length thresholds. (A) shows the correlation between Fped and Froh 0.5, (B) shows the correlation between Fped and Froh 1.5, and (C) shows the correlation between Fped and Froh 5. For colors and details of subgroups, see Figure 4 legend. N = 249.