
Figure 2.
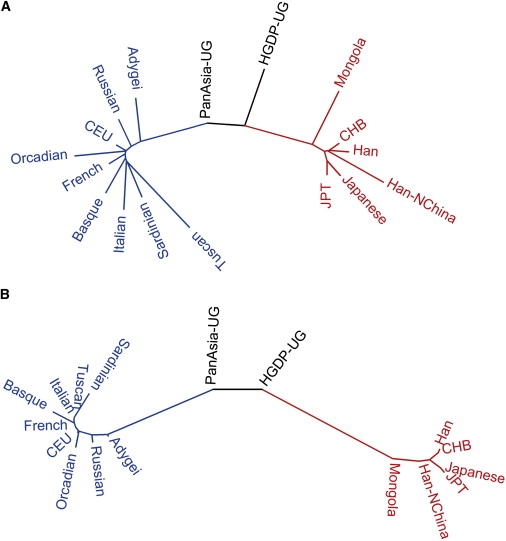
Cluster Relationship of Populations
(A) Maximum-likelihood tree of 17 populations.
(B) Neighbor-Joining tree of 17 populations based on pair-wise FST. Branches are colored according to ethnic groups; blue is used for European populations, red for East-Asian populations, and black for Uyghur populations.