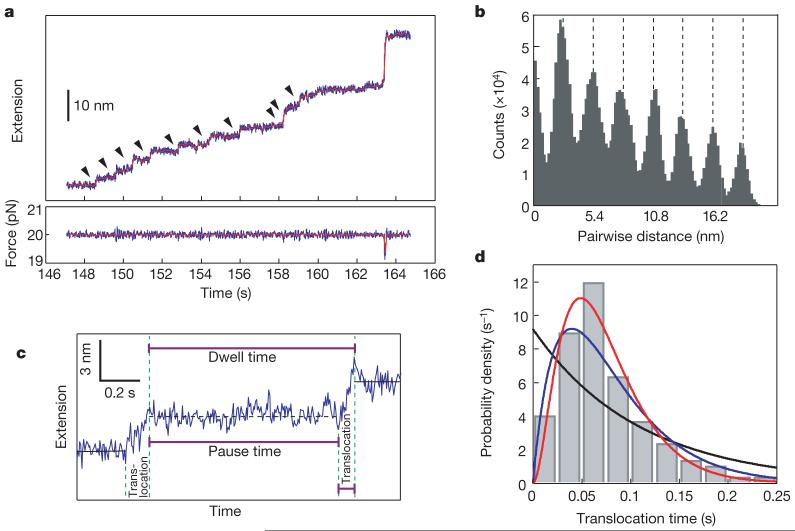
Figure 2. Codon-by-codon translation of VE60hp.
a, Extension and force trajectories during translation. The data were collected at 200 Hz (blue traces) and smoothed to 10 Hz (red). Discrete steps are indicated by arrowheads. The 18 nm rip at 163 s corresponds to spontaneous opening of the remaining approximately 18-bp hairpin ahead of the translating ribosome. b, Pairwise distance analysis of the extension trajectory in a from 147 to 157 s after correction for drift. c, The pattern of the translation process illustrated by a close-up view of the 148-150 s region. d, Distribution of translocation times. The translocation times (n = 121) were binned in 0.025 s intervals, and the probability density plotted and fitted to three possible Poisson equations (see Supplementary Information): one step (black line), two steps (blue) and three steps (red), with R2 values of 0.45, 0.87 and 0.95, respectively. The k value from the best fit (red line) is 40 ± 4 s-1. Attempts to fit the distribution to two or three steps with different rate constants gave equal rate constants as the best fit.

