
Figure 4. Dwell times and force effect.
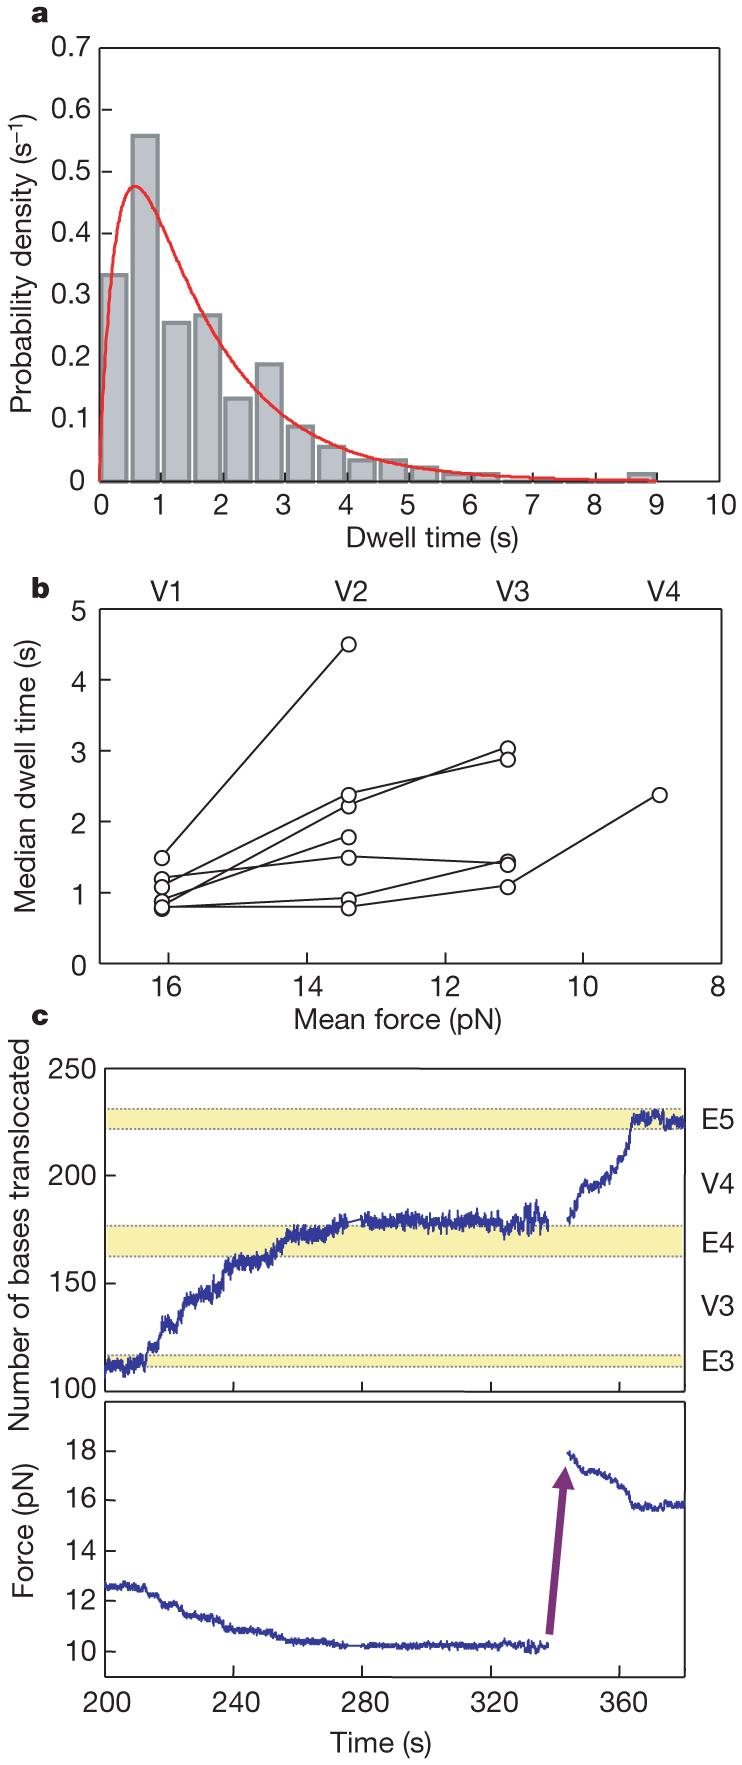
a, Distribution of dwell times from VE274hp. Dwell-time data (n = 180) are pooled from translations of the first Val patch (V1) for 12 ribosomes with mean dwell times less than 2 s. The distribution (0.5 s bins) is well fitted to a mechanism in which two consecutive reactions take place (red line), with k1 = 0.7 ± 0.2 s-1, k2 = 3.4 ± 1.8 s-1 and R2 = 0.93. b, Force effect on dwell times. The median dwell times in each Val patch are plotted as a function of force (mean force in each Val patch, V1-V4). Data points from the same ribosomes are connected by lines. c, Force effect on long pauses. In this example, the translation paused when the force dropped to about 10 pN. After approximately 1 min of pausing, the force was rapidly raised to 18 pN, and the translation resumed immediately.