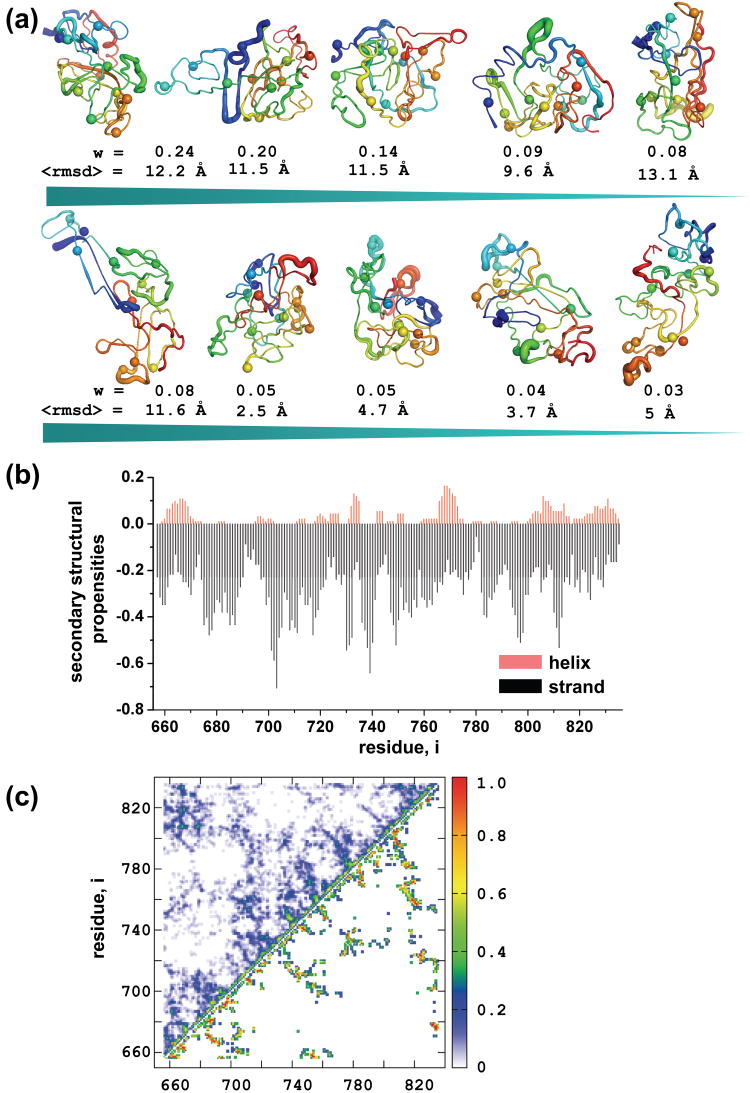
Figure 2. Ensembles of R domain structures.
(a) A diverse pool of structures with low energy is generated using DMD and an all-atom energy function, Medusa. All the decoys are clustered according to pairwise RMSD. Standard deviations of coordinates of all structures in each cluster were calculated and mapped to the centroid structure. Structures are colored blue to red from N- to C-terminus. Phosphorylation sites are represented as spheres. Weights are calculated by dividing the number of decoys in each cluster by the total number of structures (n=92). (b) Secondary structural content of all the decoys were subtracted and population weighted averages were generated for each position. Alpha helical probabilities are plotted in the positive, and the β-sheet propensities in the negative region of the graph. (c) Contact maps of the most (upper diagonal) and the less (lower diagonal) populated clusters. Contacts are counted in all structures in a given cluster and divided by the total number of decoys in that particular cluster.

