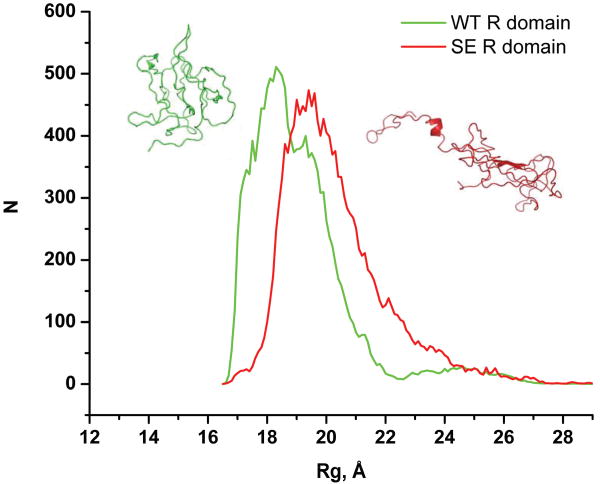
Figure 3. R domain size is increased by phosphorylation-mimicking S→E substitutions.
Radius of gyration of the WT and S→E R domain are collected from trajectories of equilibrium simulations. Histograms had been generated and Gaussian fitting is performed to determine the peaks of the WT (18.2 Å, 19.1 Å) and the S→E (19.7 Å, 22.1 Å) distributions. Kolmogorov-Smirnov test is used to verify the difference between the two distributions (P-value = 0.03). A more closed conformation of the WT domain is depicted on the left (green), and a more open conformation of the S→E R domain on the right (red).

