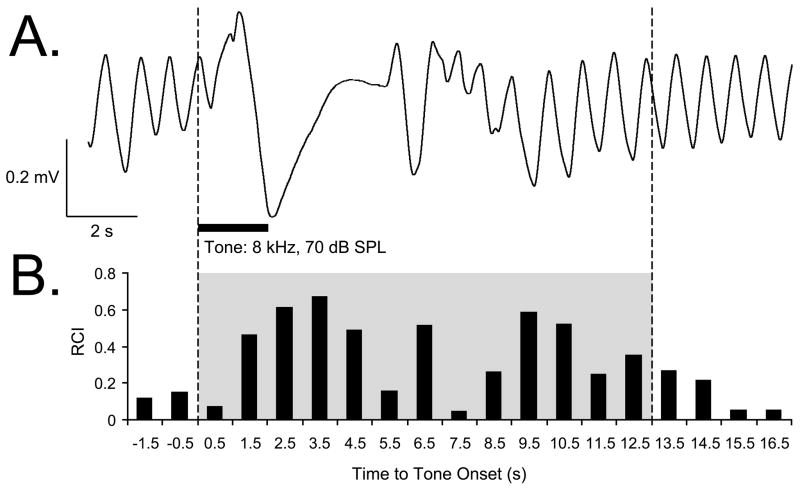
Figure 2.
Respiration signal and its quantification. (A) An example of a regular sinusoidal baseline respiration record disrupted by tone presentation. (B) Quantification of the respiration record shown in (A). The “Respiration Change Index” (RCI, see Methods) is sensitive to both increases and decreases in signal amplitude and frequency. The example shows a typical response of a Saline animal to the CS tone, recorded while obtaining the behavioral frequency generalization gradient 24 hours following completion of the pairing session. The shaded area indicates the first 13-s portion of the respiratory record containing the majority of tone-evoked response. The RCI values found within this epoch were used in the behavior data analysis.

